Know your racks are cool. Before they aren't.
Self-hosted thermal & SNMP monitoring for server rooms, colocation and edge sites — live rack heatmaps, alerts that don't cry wolf, SLA reports and a public status page. On your own box, in minutes.
Everything to keep a room from cooking itself.
Not a framework to assemble — a finished monitor. Real screenshots, no mockups.
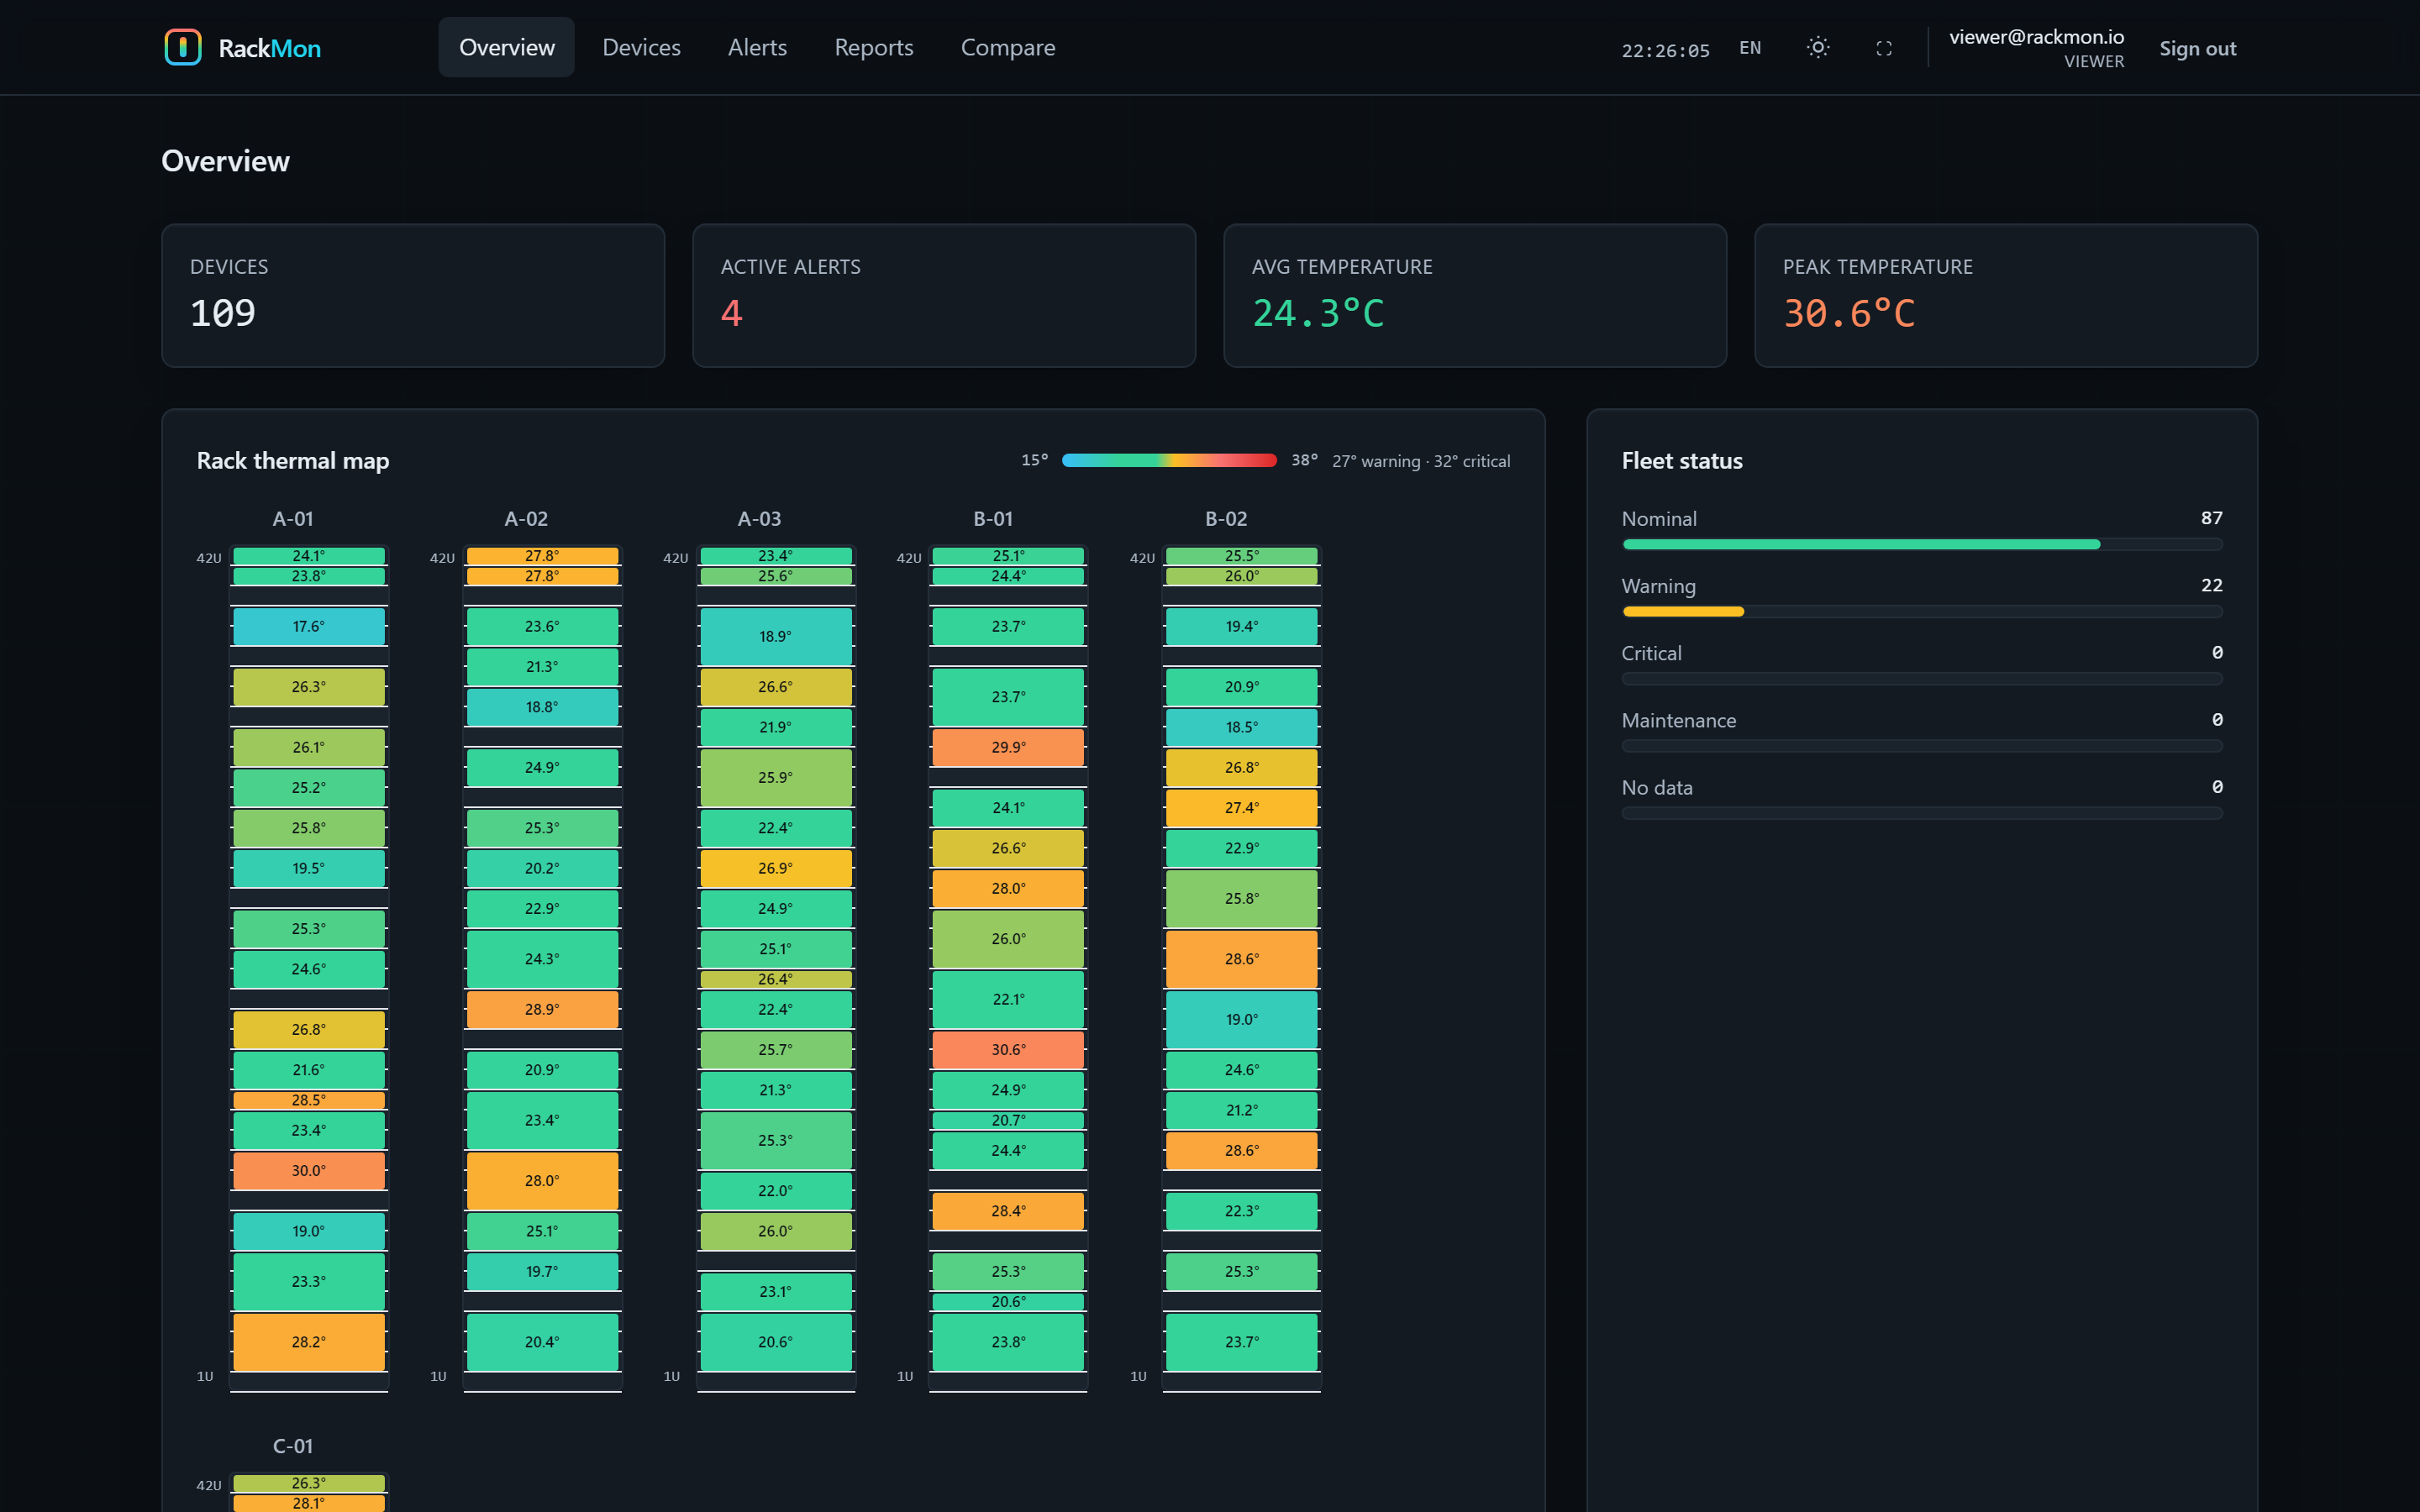
A rack you can read at a glance.
Every rack rendered U-by-U and colored by temperature. The hot node is obvious — no graphs to assemble, no queries to write.
- Per-U thermal map for every rack
- Fleet roll-up: nominal / warning / critical
- Average and peak temperature up top
Telemetry with teeth.
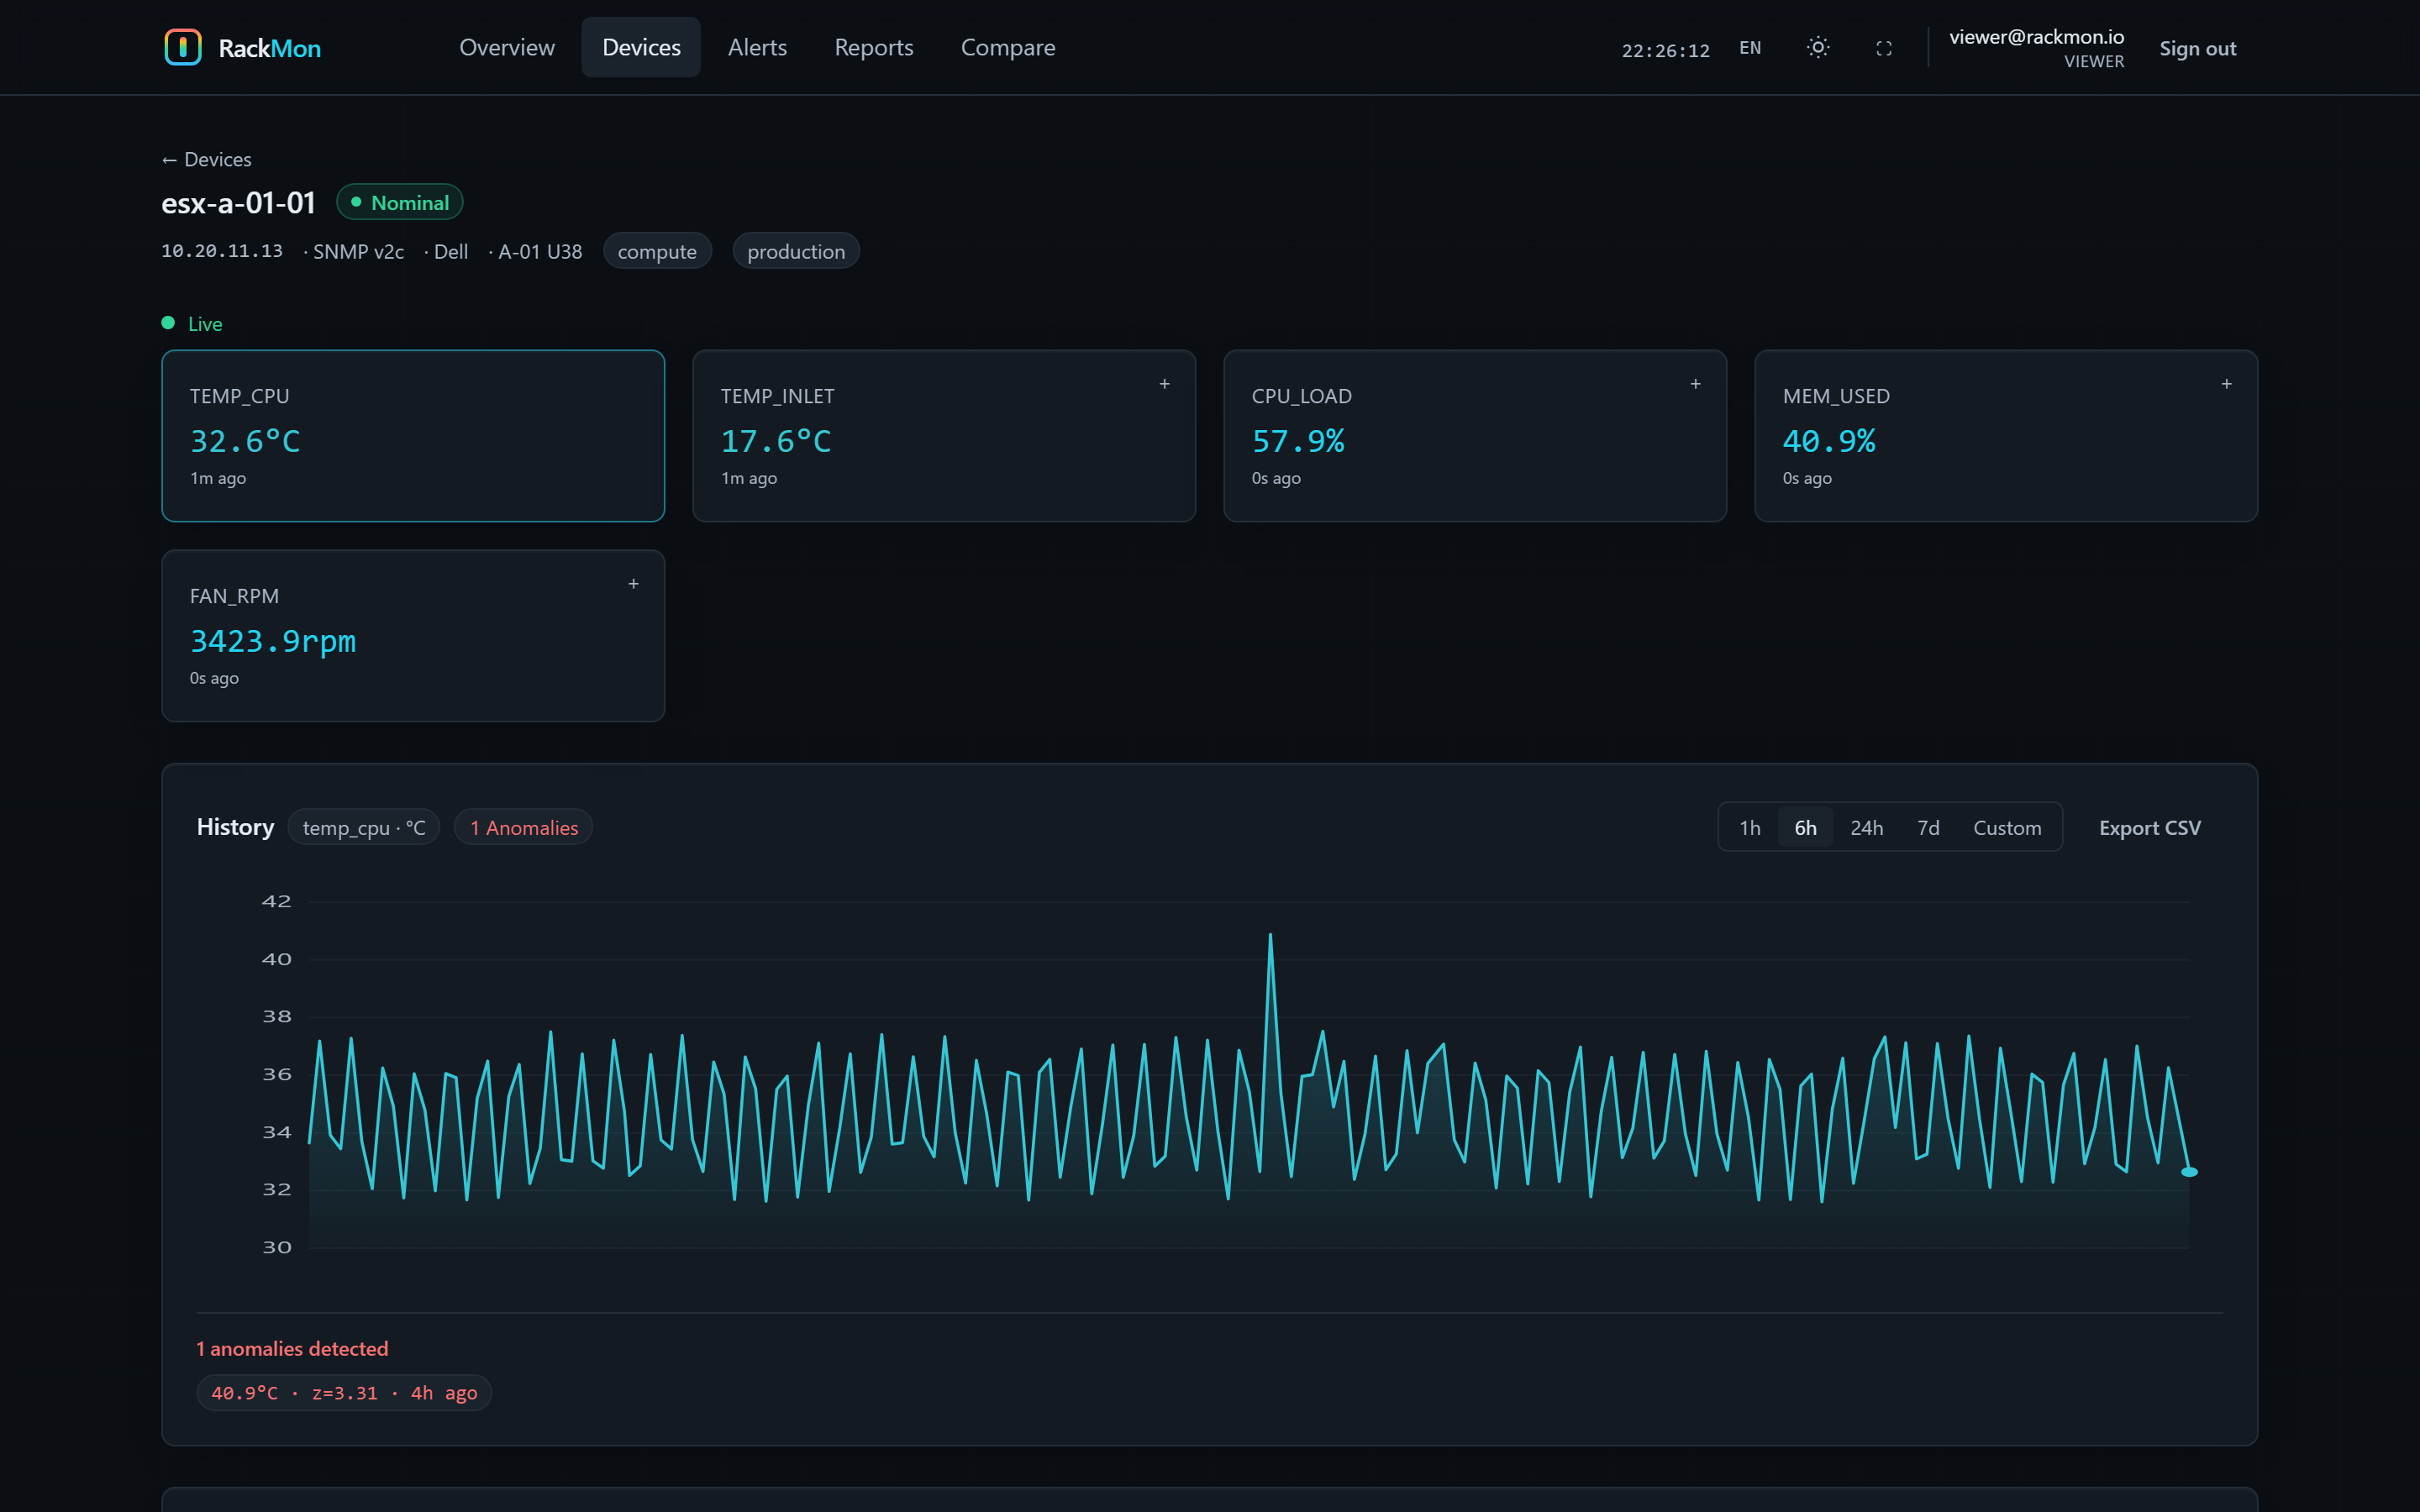
Open any device for live SNMP readings over WebSocket, history (30 days by default, configurable), anomaly detection and one-click CSV — temperature, CPU, fans and memory in one view.
- Live values, updating in real time
- Area charts: 1h / 6h / 24h / 7d
- Anomaly flags (z-score) on the timeline
Alerts that respect your team.
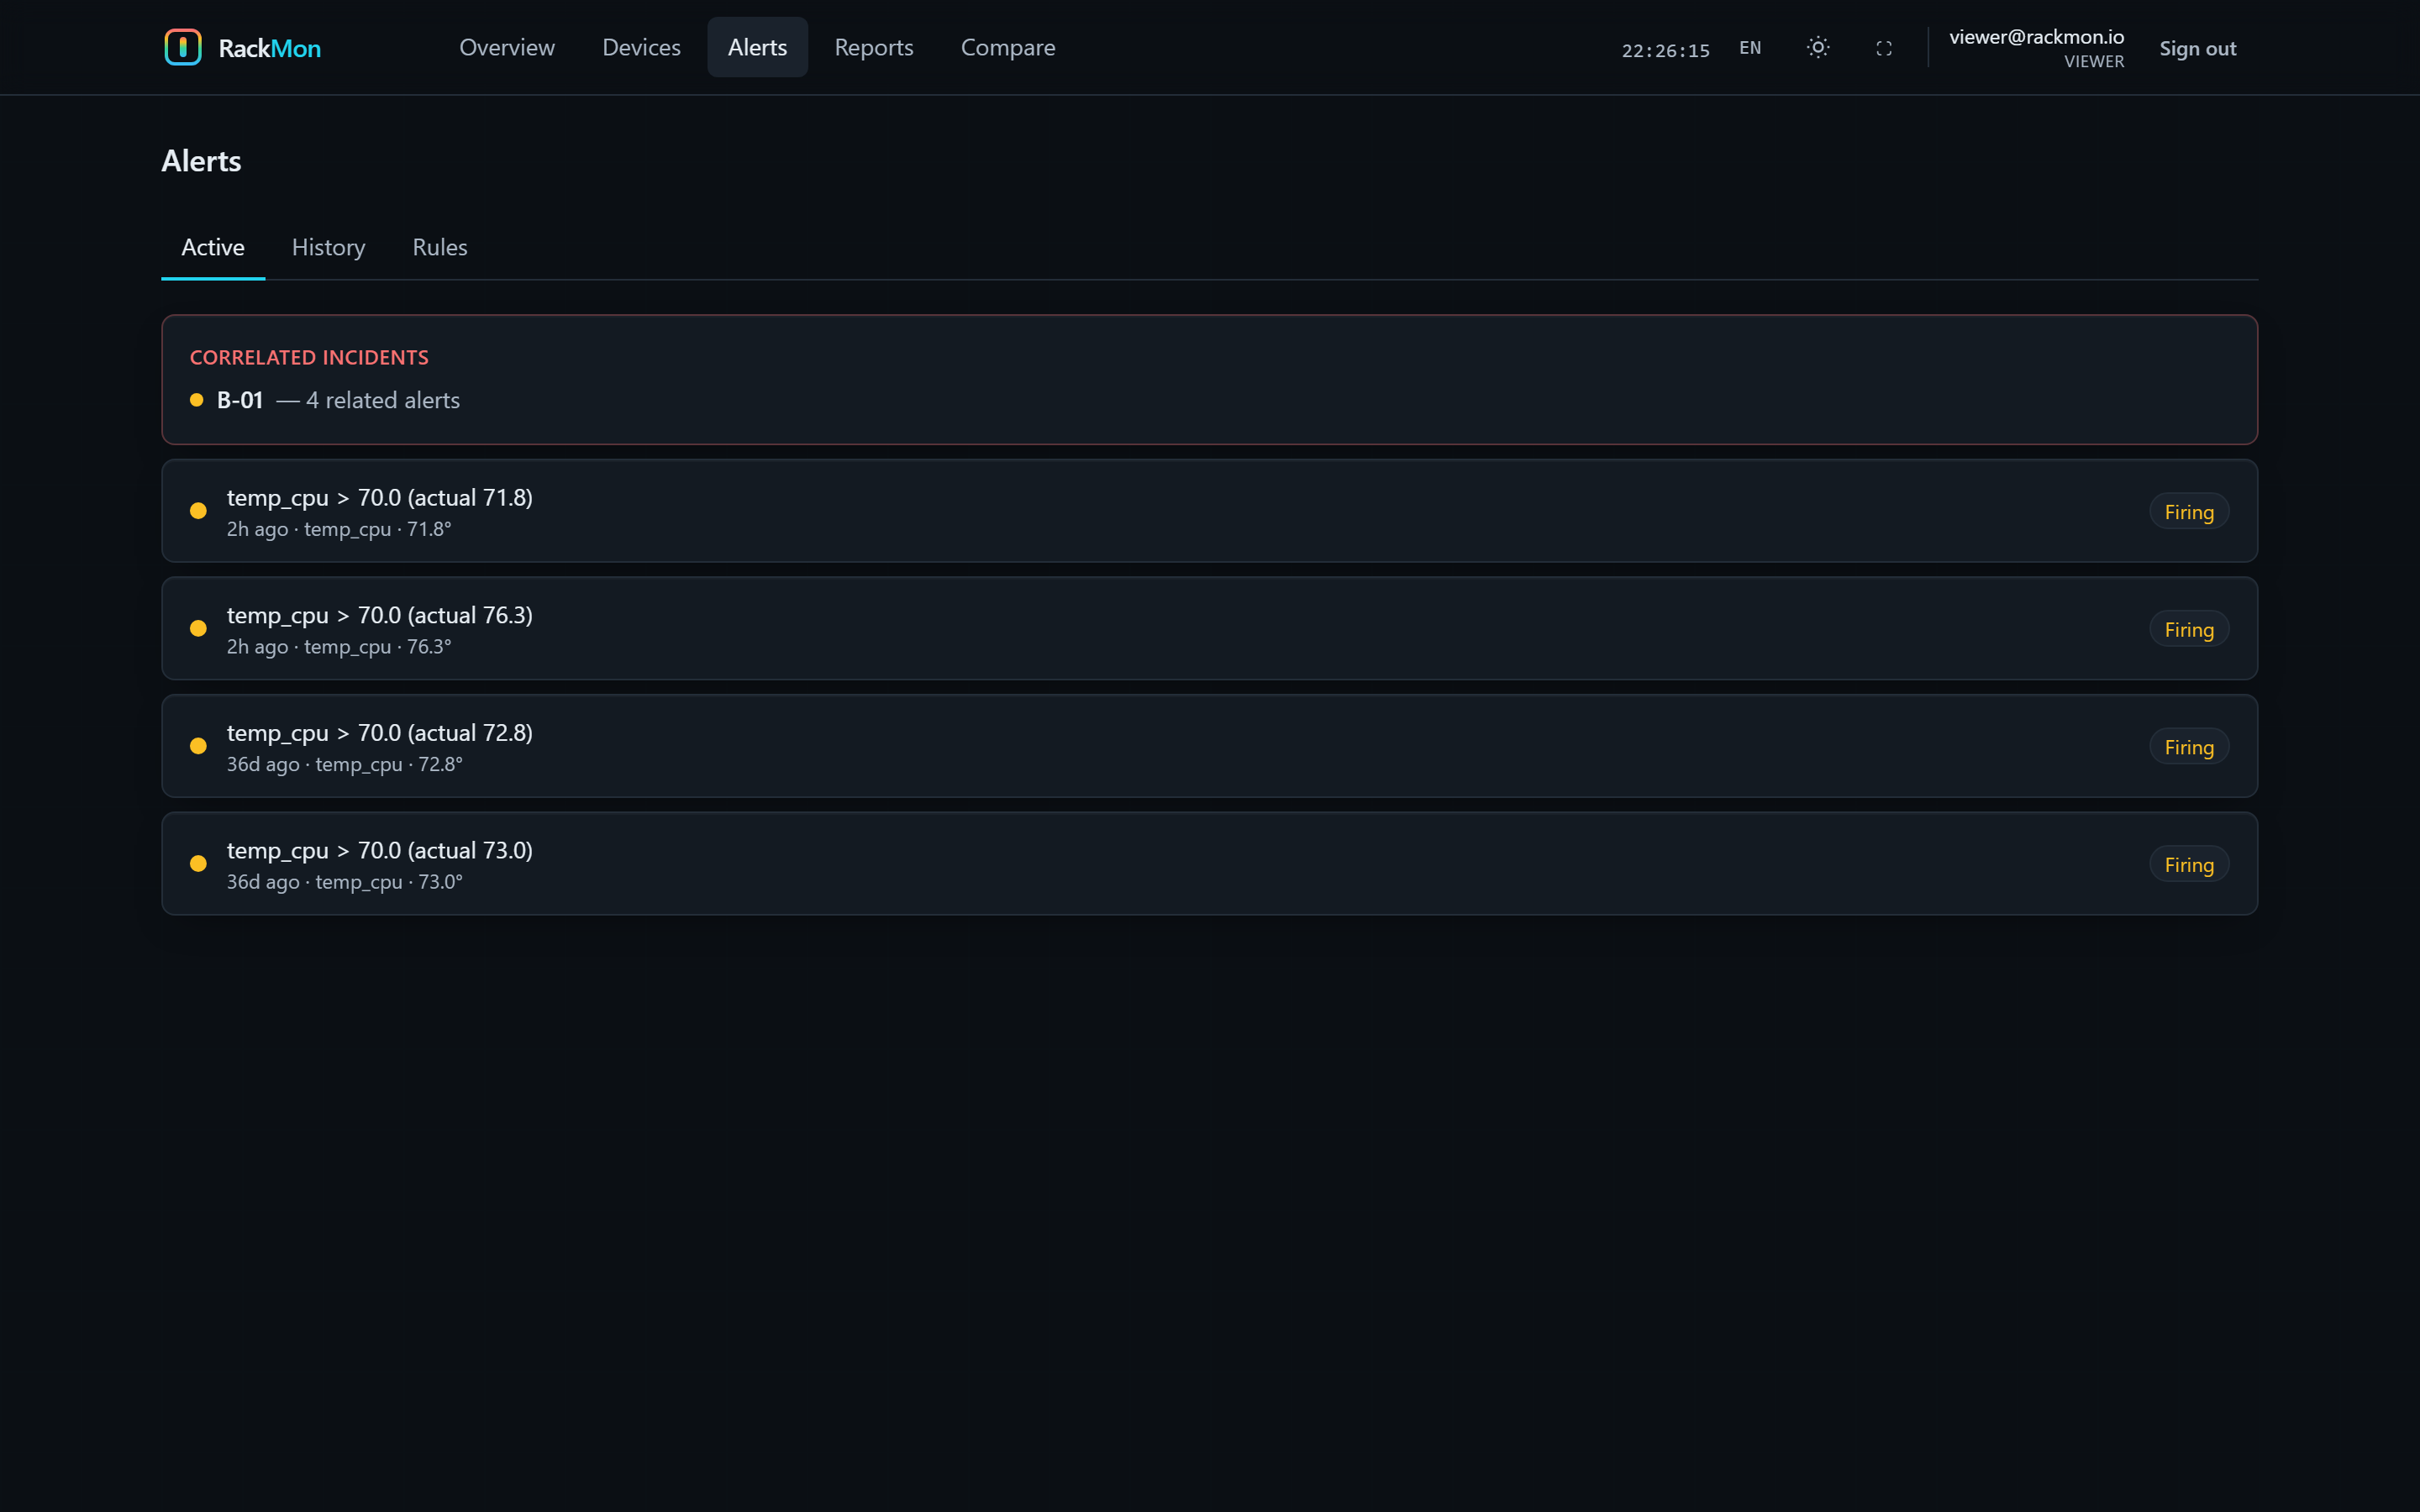
Rules with hold windows, dedup, snooze and escalation — grouped into correlated incidents by rack. A missing reading or a maintenance window never fakes an all-clear.
- Ack, snooze & resolve with an audit trail
- Email · Slack · Teams · webhook · Telegram
- Correlated incidents, not a wall of noise
Reports your clients will accept.
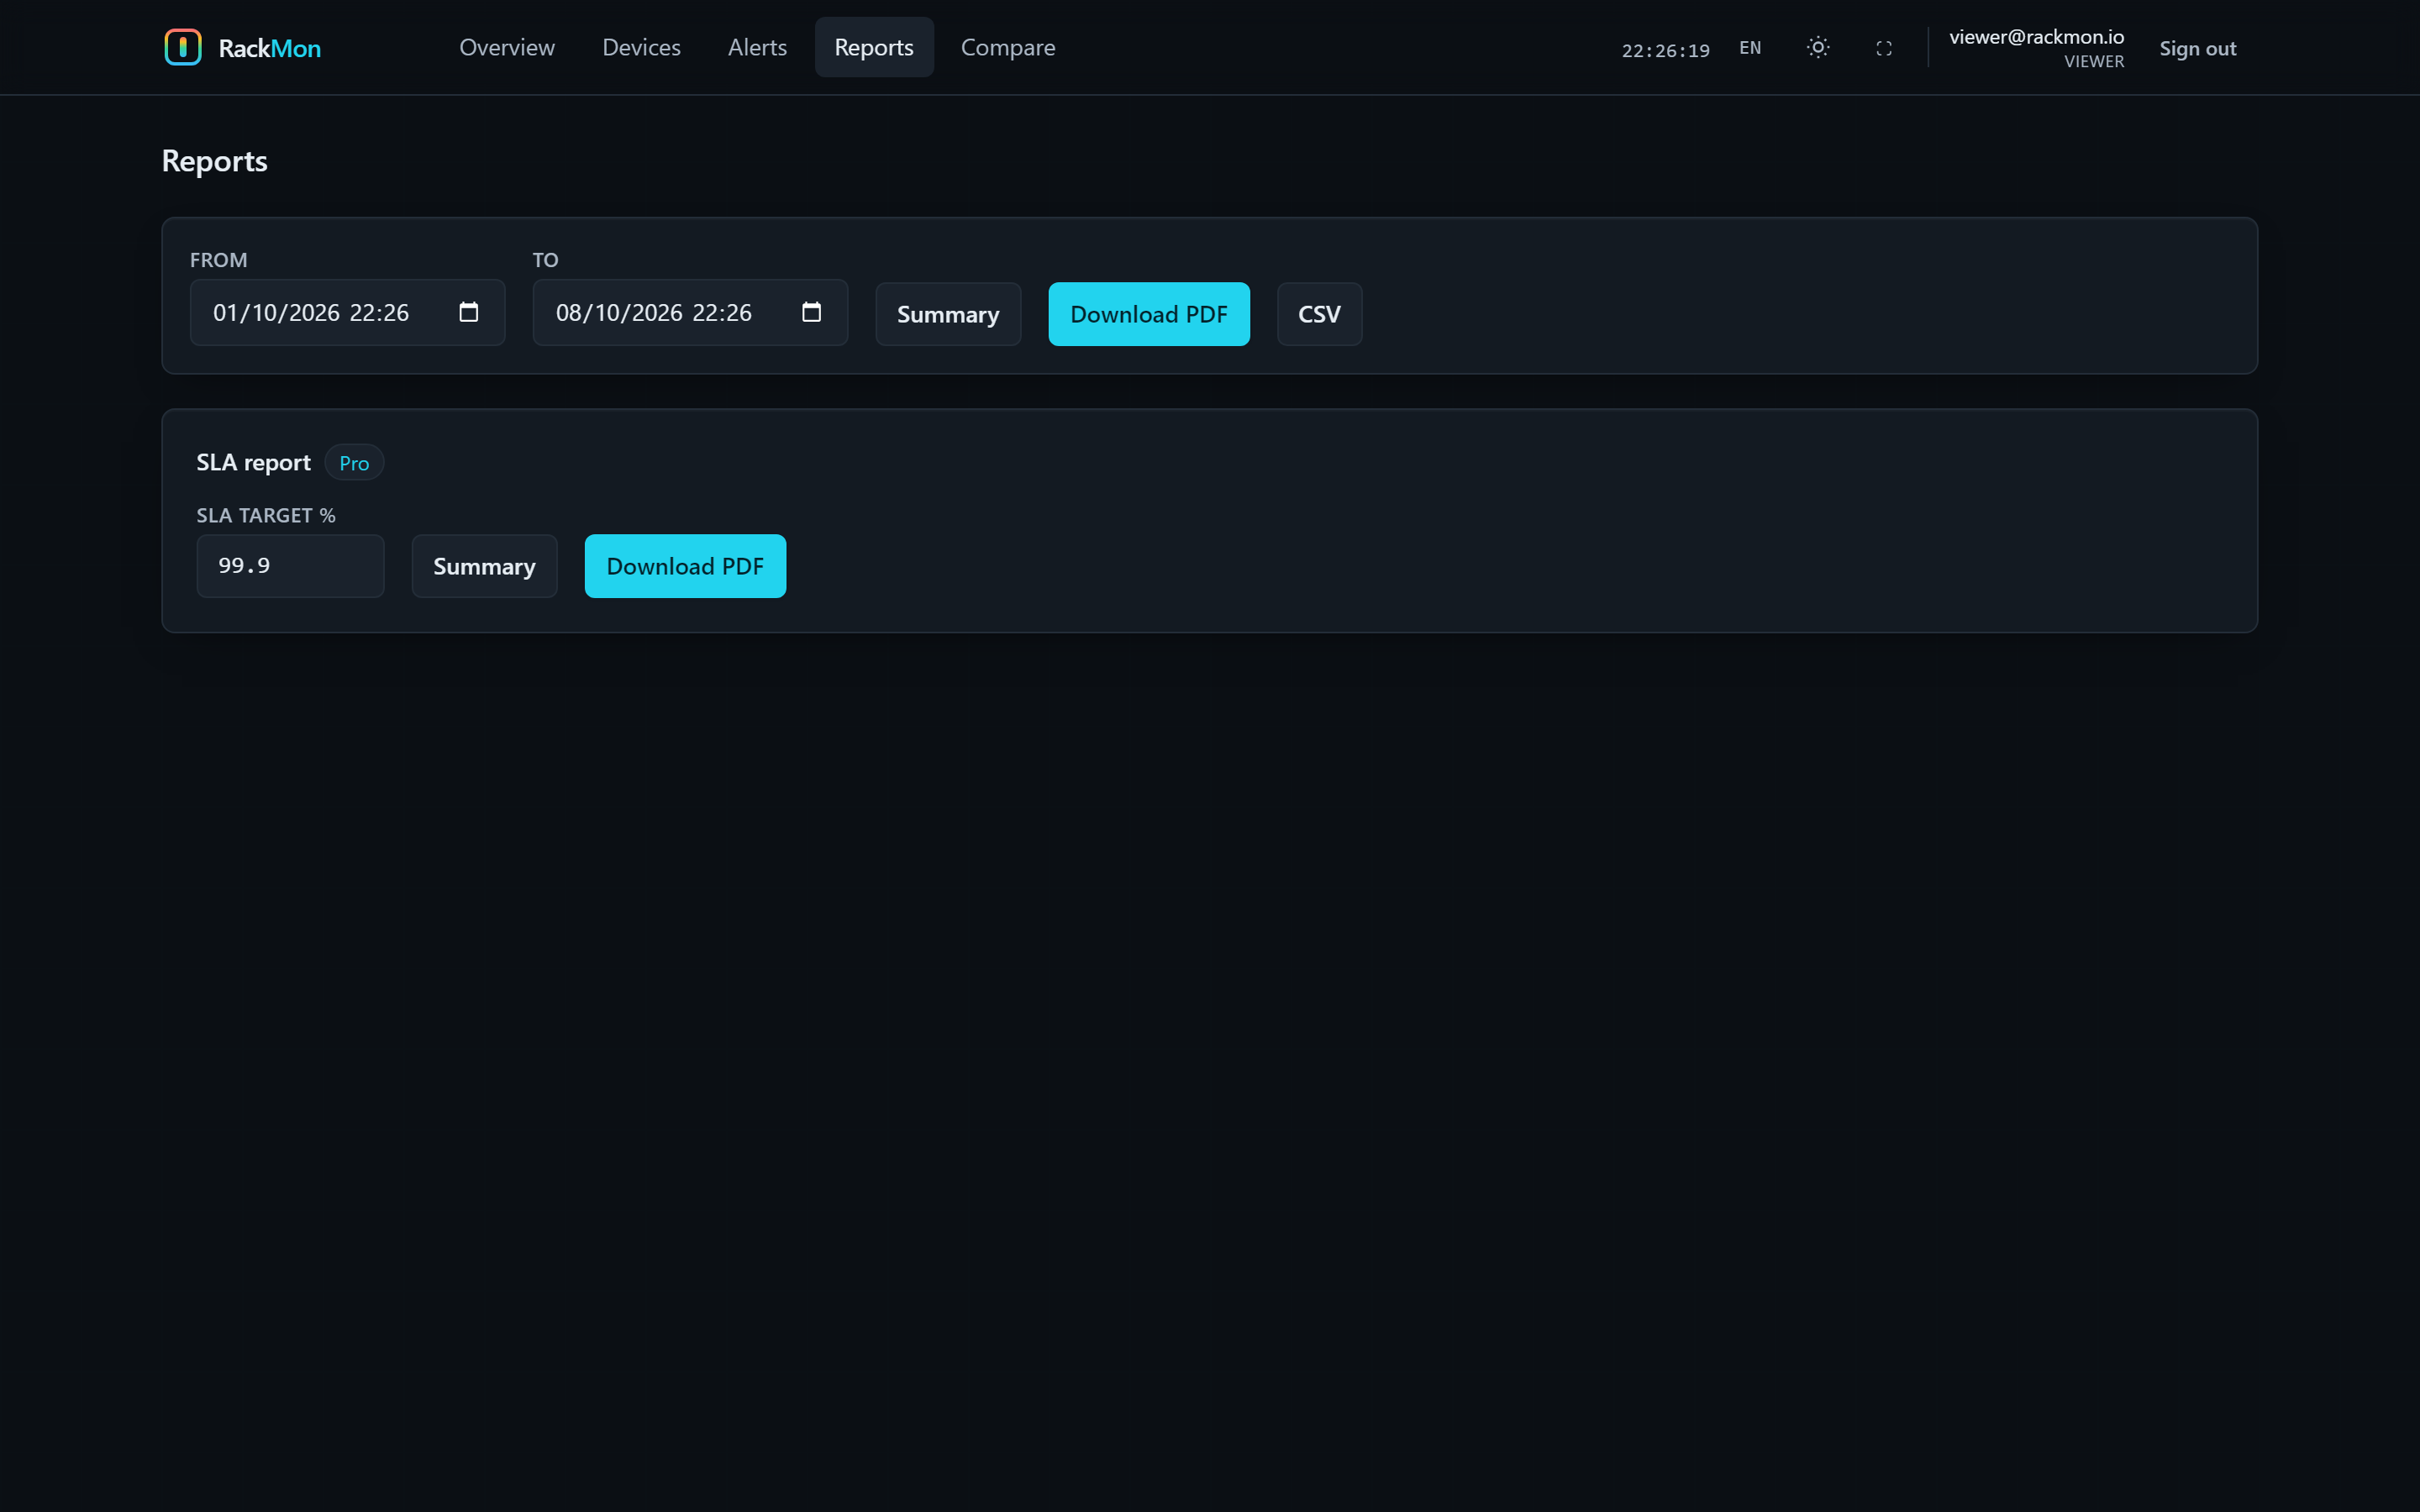
Availability, SLA compliance, MTTR and downtime per device — as a PDF. Plus a sanitized, public status page you can put in front of tenants.
- SLA report vs a target, PDF-ready
- Public read-only status board (no data leaks)
- White-label it: your name, logo & color
The monitor the big tools forgot to build.
Zabbix is too much to run. Enterprise DCIM is too much to buy. RackMon is the pragmatic middle.
Ten-minute setup
One container serves API and UI. SQLite to start, PostgreSQL / TimescaleDB when you grow.
Your data, your box
Fully self-hosted. No account, no phone-home. Secrets encrypted at rest.
Honest alerting
Hold windows, dedup, escalation — and it never turns a poll gap into a false recovery.
Client-ready
Public status page, SLA/uptime PDFs and white-label branding — for colo & MSPs.
Enterprise auth
SNMP v3, API keys, RBAC and a full audit log — plus LDAP/AD and OIDC SSO, included.
Thermal-first
Purpose-built for heat: rack elevations, thermal palette, temperature at the center.
From a single edge box to a fleet of client racks.
All of it, free, for everyone.
There is no Pro edition and no licence key. Every feature RackMon has — SSO, LDAP, SLA reports, the public status page, white-label branding — is in the one version you download. Self-hosted, MIT licensed, no account, no call-home, no device limit.
RackMon
- Unlimited devices & metrics
- Rack heatmaps & live telemetry
- Alerting: email · Slack · webhook · Teams · Telegram
- SNMP v2c/v3 · discovery · reports
- SSO (OIDC) & LDAP / Active Directory
- Public status page
- SLA & availability reports (PDF)
- White-label branding
If it saves you a bad night, a star on GitHub or a word to someone who needs it is all I ask. Built and maintained by Enrique González Romero — I read every issue.
Running in about ten minutes.
One image serves the API and the web UI on port 8000.
Discovery finds SNMP hosts; the simulator gives you live data instantly.
Thresholds, hold windows and channels — email, Slack, webhook, Teams, Telegram.
A star on GitHub, or a word to someone whose racks run hot. That is the whole business model.
Stop finding out from the smell of hot plastic.
Deploy RackMon free, with every feature, and see every rack's temperature in the next ten minutes.